The Charity Commission

Featured
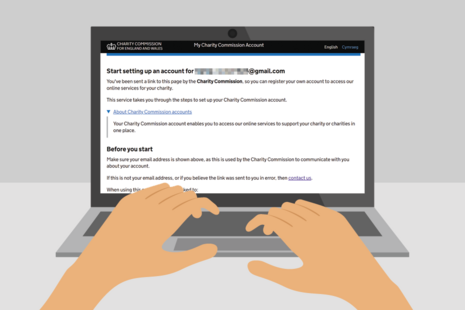
How to set up and use your new ‘Charity Commission Account’ to access online services on behalf of your charity.
Charity Commission Inquiry into Children Care Centre.

Charity Commission inquiry into Islamic Education Centre and Mosque

The Charity Commission has launched a statutory inquiry following concerns over how charitable funds have been used by a now sanctioned individual.
The Charity Commission has concluded its inquiry into Jamia Hanfia Ghosia Mosque and Princess Street Resource Centre.
Charity Commission case reports, decisions made, inquiry reports, regulatory alerts and statements on live cases.
Latest from The Charity Commission
What we do
We register and regulate charities in England and Wales, to ensure that the public can support charities with confidence.
The Charity Commission is a non-ministerial department.
Follow us
Documents
Transparency and freedom of information releases
Our management


Contact The Charity Commission
Contact Centre
Our advisors are available Monday to Friday, 9am to 5pm, except for Wednesday between 12:00pm and 1pm when we are closed for staff training.
0300 066 9197
Calls are charged at standard rate. Call charges and phone numbers - https://www.gov.uk/call-charges
Our telephony lines will close to new calls no later than 4.45pm each afternoon and no later than 11.45am each Wednesday morning, to allow us to reach customers who are already waiting.
Charity Commission Contact forms.
https://forms.charitycommission.gov.uk
Find out how to get a password or log in to Charity Commission online services.
https://www.gov.uk/guidance/online-services-for-charities
You can write to us at the address below, but you will get a much quicker answer by using the phone.
Charity Commission
PO Box 211
Bootle
L20 7YX
The Charity Commission is committed to providing a quality service to all our customers, and we expect everyone who comes into contact with our staff to treat them with respect.
Read our unacceptable customer behaviour policy and procedure.
https://www.gov.uk/government/publications/charity-commission-unacceptable-customer-behaviour-policy-and-procedure
Report a serious incident on behalf of a charity’s trustee body
You may experience technical issues with the Reporting Serious Incidents (RSI) form. We apologise for any inconvenience.
If you require help, please contact us on 0300 066 9197 during our opening hours of 9am to 5pm Monday to Friday.
Charities must report serious incidents to us, and explain how incidents are being dealt with
Find out how to report serious incidents and what to report.
https://www.gov.uk/guidance/how-to-report-a-serious-incident-in-your-charity
Whistleblowing
Find out what sort of wrongdoing you can report to the Charity Commission, and how to report it.
https://www.gov.uk/guidance/report-serious-wrongdoing-at-a-charity-as-a-worker-or-volunteer
Freedom of Information (FOI) requests
Read our privacy notice about how we process your data when you submit a Freedom of Information (FOI) request
www.gov.uk/government/publications/charity-commission-freedom-of-informationenvironmental-information-regulations-request-privacy-notice
Make an FOI request
- Read about the Freedom of Information (FOI) Act and how to make a request.
- Check our previous releases to see if we’ve already answered your question.
Corporate information
Jobs and contracts
Read about the types of information we routinely publish in our Publication scheme. Our Personal information charter explains how we treat your personal information. Read our policy on Social media use. Find out About our services.